Project Marinus will unlock the value
of Tasmania as a renewable energy powerhouse we are told. The basis for this
claim is difficult to find. It is yet to be publicly revealed how consumers and
government owned electricity companies, Hydro Tasmania and Tas Networks will benefit.
More wind farms will be needed and it
is for that reason this blog takes a close look at Woolnorth Wind Farm Holding
P/L (WWF) which has just released its financials for the calendar year 2021.
WWF produces about 10 per cent of
Tasmania’s electricity needs. In 2021 it received an estimated $95 for each MWh
of electricity produced, a slight rise from $94 in the 2020 year.
WWF sells its output to Hydro Tasmania
pursuant to a power purchase agreement (PPA). Without the PPA, had WWF sold its
output into the spot market it would have only earned an estimated $60 per MWh
(2020: $74 per MWh).
Hydro therefore subsidised WWF to the
tune of $36 per MWh for 2021, an estimated $34 million in total.
The Shenhua Group a Chinese state-owned
company owns 75 per cent of WWF acquired from Hydro which still owns the
remaining 25 per cent. Shenhua bought its share subject to Hydro agreeing to
the PPA.
Over the remaining term of the PPA
Hydro is likely to pay subsidies to WWF which will be more than enough to repay
WWF’s borrowings which at Dec 2021 stood at $239 million.
Had Hydro not sold its 75 per cent
share it would have been able to repay the borrowings used to construct WWF. Instead,
it pays subsidies to WWF to do the same thing.
It follows the pattern established by
the Basslink deal, rather than the government owned Hydro building and owning
the cable, it was decided to pay someone else to do it. The payments that have subsequently
been made would have paid for the cable twice over. Apart from the two carbon
tax years there’s not a lot to show from the now abandoned Basslink deal except
Hydro with more debt and a community that has suffered as a result.
The pattern of privatising benefits and socialising losses is evident from WWF’s latest financials. In the absence of any clear evidence of how benefits and costs of the Marinus Project are to be shared one is left with the forlorn conclusion that past practices are likely to be repeated.
Introduction
Tasmania, so the story goes, has a
significant comparative advantage in generating renewable energy.
It only requires a bit of help to get
its products to market.
That’s why $3.5 billion Project
Marinus is being proposed as the second interconnector to link Tasmania to the
National Electricity Market (NEM).
With wind farms at Granville Harbour
and Cattle Hill coming online in the last two years, doubling electricity from
wind from 10 per cent to 20 per cent of the State’s needs, the State is
self-sufficient. Hydro Tasmania’s hydroelectric system is rated as being
sufficient to generate the remaining 80 per cent of our needs.
To justify Project Marinus there
needs to be available electricity to send into the NEM. To date Basslink imports have exceed exports.
But to build more generation Project
Marinus needs to be a goer. One without the other won’t occur. To borrow the
words of Bruce Mountain et al the two are like a train station and a train
line. One has no value without the other.
So, what is the value we can expect
new wind farms will contribute to the Tasmanian economy? How are existing wind
farms performing?
Woolnorth Wind Farm Holding Pty Ltd
(WWF) has been operating wind farms since 2004 at Woolnorth in the far northwest
and since 2007 at Musselroe in the northeast. The total capacity is 308 MW
which produces around 1,000 GWh of electricity per year, roughly 10 per cent of
Tasmania’s needs.
The wind farms were originally built
and owned by Hydro, but now WWF is 75 per cent owned by the Chinese state owned
Shenhua Group with the remaining 25 per cent share retained by Hydro.
WWFs financials
WWF lodges audited financials with
ASIC each year which together with NEM data give a good picture of WWF’s
performance.
WWF produces financials on a calendar
year basis. The recently released 2021 financials reveal a profitable company
but one which is dependent on subsidies from Hydro for its bottom line.
When Shenhua bought WWF’s 75 per cent
share from Hydro it required Hydro to agree to a power purchase agreement (PPA)
to guarantee future revenue over an agreed period. The PPA allows WWF to make
profits it otherwise would not be making.
WWF revenue principally comprises two
components -- electricity and large-scale renewable energy certificates (LGCs).
The PPA covers both.
WWF records electricity as revenue at
NEM spot prices when electricity is sold into the market and records LGCs as revenue
at contract prices at the time of generation. The contract prices are those set
out in the PPA
Take a look at the latest P&L
statement:

A healthy bottom line of a profit
before tax of $42.9 m (2020: $$132.6m). But let’s have a closer look at some of
the revenue and expenses items. Note 4 has the breakup.

In 4 (a) above, energy sales are the amounts received from spot prices when electricity is sold, and environmental energy product sales are LGC sales as per the PPA agreement.
WWFs performance on a MWh basis
WWF produced 976,775 MWh of
electricity in 2021 (2020: 1,035,894 MWh). The decline in 2021 was due to the
wind farm on the Woolnorth property operating at 50 per cent capacity for 5
months or so.
The number of LGCs produced is the
same as the MWh (NB one MWh creates one LGC).
To understand what this means from a
$ per MWh viewpoint the following will assist.
|
WWF Revenue per MWh |
||
|
2021 |
2020 |
|
|
Electricity
sales $'000 (1) |
21,128 |
34,763 |
|
LGC
sales $'000 (2) |
45,580 |
47,906 |
|
GWh
generated ‘000 MWh |
957 |
1,036 |
|
Electricity
price per MWh $ |
$22 |
$34 |
|
LGC
price per unit $ |
$48 |
$46 |
|
(1)
Electricity sales based on spot prices |
||
|
(2) LGC
sales based on PPA contract prices |
||
In 2021 WWF received $22 per MWh for
electricity (2020: $34), and $48 per LGC (2020: $46)
Tasmanian wholesale spot prices have
been less than prices in the other states in NEM. The pattern of average
quarterly prices for 2020 and 2021 is shown below.
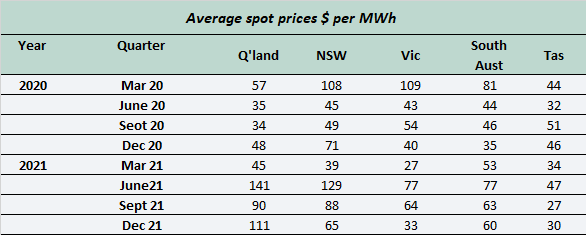
A chart presents the data in a more accessible form:

Tasmania’s spot price is usually less
than other states. As a wind farm operator WWF would be lucky to achieve
average spot prices, because of the nature of its product which is sold
whenever the wind blows and electricity is generated. It is a price taker
operating at the whim of the wind and markets.
In addition, the PPA requires Hydro
to pay WWF if wholesale electricity spot prices are below prices agreed to in
the PPA. The detailed P&L above includes under other income the agreed top
up payments, $24.3 million in 2021 ($14.67 million in 2020) described as
‘realised gain on power purchase agreement’.
The amended revenue per MWh is therefore:
|
Adjusted WWF Revenue per MWh |
||
|
2021 |
2020 |
|
|
Electricity
sales $'000 |
45,437 |
49,430 |
|
LGC
sales $'000 |
45,580 |
47,906 |
|
GWh
generated '000 MWh |
957 |
1,036 |
|
Electricity
price per MWh $ |
$47 |
$48 |
|
LGC
price per unit $ |
$48 |
$46 |
|
Total
price per MWh $ |
$95 |
$94 |
Future WWFs subsidies
Spot prices for LGCs were less than PPA
contracted prices and are expected, at this stage, to remain so for the
duration of the PPA. The financials reflect this. At the end of 2020 WWF
included as an asset on its balance sheet the expected value of top up payments
over the life of the PPA, believed to be until 2028 even though the LGC scheme
will continue until 2030. At Dec 2020, the financial asset being future LGC
top-ups was valued at $96 million. By Dec 2021 it had grown to $111.6 million,
an increase of $15.6 million which is included in the detailed P&L above as
fair value gains and losses (see also
Notes 4 (d) and 4 (e) included above). The balance sheet shows this:

The accounting treatment of the future
value of the LGCs as recorded in WWF’s books differs from the way future
expected wholesale electricity sales are treated.
The LGC deal is a financial asset and
movements are recorded as just described. On the other hand, the liability for
a top up payment of wholesale electricity proceeds doesn’t arise till the
electricity is sold into the market. The
exact liability is not known until that occurs. It’s a liability to Hydro. To WWF it’s an
asset. Hence there is nothing in WWF’s financials to indicate future possible
top up payments expected when PPA electricity contract prices exceed spot prices.
Accounting standards often produce anomalies. The different treatment of LGC
top ups versus electricity price top ups is one such anomaly.
There is another note, Note 17, which
gives an estimate of the LGC top up payments over the life of the deal. Whilst
the present value of future payments is $111.63 million at the end of 2021, the
nominal amounts expected to be paid over the duration of the PPA are listed in
the following extract from Note 17 :

That means another $150m is expected to be paid by Hydro for LGC top ups.
This will clear most of WWF’s borrowings which were $ 239 million at the end of 2021.
Hydro records the value of its 25 per
cent WWF interest in its books. At June 2021 it was valued at $71 million. It
is simply 25 per cent of WWF’s equity as per WWF’s balance sheet. With equity
of $298 million as at Dec 21 (see WWF’s balance sheet above) this would mean
Hydro’s share was worth just a tick under $75 million. But with a future liability
for LGC purchases of $111 million and possibly at least as much again due to electricity
price subsidies to WWF, the value of Hydro’s investment in WWF is well and
truly negative. The sale of the WWF share and the accompanying PPA has, with hindsight,
cost Hydro dearly.
The problem with all these types of
deals is that we never find out until it’s too late. Commercial in confidence keeps
many sins hidden.
Future top up payments for LGC payments may not eventuate as the outlook at Dec 21 suggested. It may be better. It may be worse. It all depends on what happens to LGC spot prices. Most observers believe spot prices are likely to fall. The following chart from the Clean Energy Regulator which administers LGCs, shows historical LGC spot prices and forward prices which are used to value future LGC top ups and hence the amounts recorded in WWF’s financials.

Forward prices are less than
historical spot prices which suggest future top ups are likely to increase.
This is what the financials suggest will happen.
For much of 2021 spot prices were between
$30 and $40 per LGC and probably averaged around $37 for the year. The 2020
year saw prices slightly higher averaging around $40 per LGC.
If we go back to the adjusted revenue
per MWh above, the PPA contracted price appeared to be around $46 to $48 per
LGC. Which puts Hydro top ups at $10 per LGC in 2021 and $6 per LGC in 2020. In
$ terms that’s a top up payment of $9.6 million in 2021 and $6.2 million in
2020. This is an estimate of the LGC top ups for LGCs produced in those years
which are included in LGC contractual payments by Hydro to WWF recorded in the
P&L.
EBIT estimates for WWF
It’s a useful exercise to look at the
EBIT for WWF for both the 2020 and 2021 years, as per the financials and then
adjusted to remove the Hydro subsidies/top ups.
Let’s go back to the P&L shown
again below.
To calculate earnings before interest
and tax before and after Hydro top ups it is necessary to remove finance costs
and fair value gains and losses.
The resultant EBIT (which includes Hydro
subsidies) is $39.2 million for 2021 (2020: $41.4 million).
Hydro top ups for electricity are listed
in the P&L at $24.3 million for 2021 (2020:$14.7 million) and the estimated
top ups for LGCs as noted above were $9.6 million for 2021(2020: $6.2 million).
The resultant EBIT adjusted to
exclude Hydro top-ups is therefore $5.3 million for 2021 and $20.6 million for
2020. These are the EBITs which an unsubsidised
WWF would have made.
Given that there is a non-cash
expense for depreciation of $29.3 million in 2021 (2020: $29.1 million) cash earnings
before depreciation are $34.6 million for 2021 (2020: $ $49.7 million). Enough
to repay a chunk of borrowings. And pay dividends of $5.4 million (2020:$17.4
million). Hydro’s share of dividends is 25 per cent.
A 200 per cent renewable energy
target for Tasmania implies an additional 10,000 GWh of electricity. That’s
going to require 3,000MW of extra capacity (assuming all will come from wind
projects) which at a capital cost of $250 million per 100 MW is going to cost
$7.5 billion . Add that to the cost of Marinus and the overall project cost is
$11 billion.
If we go back to the WWF revenue per
MWh and update it for the EBIT calcs with and without Hydro subsidies the
figures look like this.
|
Adjusted WWF Revenue per MWh |
||
|
2021 |
2020 |
|
|
Electricity
sales $'000 |
45,437 |
49,430 |
|
LGC
sales $'000 |
45,580 |
47,906 |
|
GWh
generated '000 MWh |
957 |
1,036 |
|
Electricity
price per MWh $ |
$47 |
$48 |
|
LGC
price per unit $ |
$48 |
$46 |
|
Total
price per MWh $ |
$95 |
$94 |
|
EBIT as
per financials $'000 |
39,212 |
41,430 |
|
EBIT
excl Hydro top ups $'000 |
5,303 |
20,563 |
|
EBIT as
per financials per MWh $ |
$41 |
$40 |
|
EBIT
excl Hydro top ups per MWh $ |
$6 |
$20 |
The EBIT per MWh in 2020 was $20. In 2021
it fell to $6 due partly to some of the turbines at Woolnorth not operating at full
capacity for the whole year.
Let’s say the adjusted EBIT is $15
per MWh for 2021. Ignoring the fact that new wind farms won’t be eligible for
the LGC system which is due to run out in 2030 (unless it continues via a
modified system which will include Carbon Credit Units ACCUs currently becoming
more widely used), ten wind farms the size of WWF will be required. At $15 per
MWh total EBIT will be $150 million. For windfarms costing $7.5 billion that’s a bit light on.
Concluding comments
Without Marinus more Tasmanian
windfarms make no sense. With Marinus
they only make sense if consumers are willing to pick up the tab via higher
transmission charges so a few Tasmanian wind producers can get their projects
off the ground, manage to pay their financiers, and hope for a capital profit at
some stage which can be diverted to a tax haven. Even though EBITs are reasonably low once the non-cash depreciation amounts are considered cash earnings are sufficient to service borrowings. Like most geared infrastructure projects there won't be much cash being spread amongst communities once operations commence. Wind farms are cheap to run. It suits investors. It's getting electricity to market that's the problem.
Who wouldn’t prefer generation situated
closer to where it was needed, preferably in their own State rather than pay
higher transmission costs to send electricity from Tasmania? Undersea cables are eight times more
expensive than land-based cables.
Tasmania can generate wind power. But
it’s not an attribute that’s unique to us. A recent post on the Renew Economy website showed the top performing
wind farms around Australia in May 2022.

The top performer operated 45 per
cent of the time. Anything above 40 per cent is a good performing wind farm.
The only Tasmanian wind farm on the list was Granville Harbour ranked four.
There are plenty of windy places in Australia which will need much less costly
transmission infrastructure than is planned by Project Marinus.
The whole point of this detailed look
at the performance of a large wind farm such as WWF is to understand how the
current system works. What are the benefits? How are they shared? Who bears the
costs? The need for more renewable energy is a no brainer. Aside from saving the planet aspect, all
projects to enhance our energy security will have winners and losers.
Take Basslink for instance. The
arbitrage advantages of the link were greatly overstated. The costs have
principally been borne by the Tasmanian community with the benefits accruing mainly
to financiers and a Singapore based company.
For a windfarm such as WWF the benefits
have principally accrued to a Chinese owned company with the costs again borne
by Hydro and ultimately the Tasmanian community.
With Project Marinus and the
necessary extra windfarms needed to complete what will be a $11 billion deal at
least, the arbitrage advantages that makes this a must-do project are not
evident. We don’t have any significant comparative advantages when it comes to
wind power which requires a $3.5 billion interconnector to unlock. Any private
benefits will be dwarfed by the social costs to be shouldered by consumers and
governments. It’s a confected way to distribute largesse to a select few to the
detriment of the majority.
There are so many unanswered
questions. Who will fund the project? How much will transmission costs rise?
For Tasmanian customers? For Victorian customers? PPAs are common for wind
generators as operating costs are low and wind reasonably predictable from year
to year, and are usually a prerequisite for financiers, so who is lining up to sign
PPAs? Are government electricity businesses intending to sign more PPA as they
did with all three current Tasmanian wind farms at a cost that is largely
hidden from Tasmanians? What benefits will trickle down into government
electricity businesses? Will we see a
continuation of the pattern where benefits tend to accrue privately and losses
end up being socialised?
At this stage without any definite
answers to these questions one is left with the conclusion there are cheaper
and easier ways to speed Australia’s renewable energy transition. For
governments there are much better ways to spend scarce funds. At least the $750
million stadium proposed without a business case for Hobart will be cheaper.
Thank you! I can only imagine the work and analysis to find out what Tasmania’s privately owned wind farms have been promised behind closed doors. Marinus is madness for Tasmania. Tasmanians deserve a renewable energy future where we aren’t deliberately left the loser.
ReplyDeleteThe Marinus Project is already a dud project:
ReplyDeletehttps://reneweconomy.com.au/biggest-battery-unveiled-in-queensland-as-part-of-post-callide-battery-blitz/
Battery of the Nation my fat ass!!!
The fact that Tasmanian politicians and public servants cannot deal with the Tasmanian community on an open honest basis is quite disturbing!!
ReplyDeleteThanks John for your analysis of these vexed issues.
ReplyDeleteDid you see they ABC reporting
"Does Australia need Tasmania to become a multi-billion-dollar 'Battery of the Nation'? 28Jun22"
https://www.abc.net.au/news/2022-06-28/hydro-tasmania-battery-could-be-expensive-solution-to-blackouts/101179828
I see the quote from the Hydro's Bess Clark saying "While there is already an undersea cable connecting the island state to Victoria, called Basslink, it is running close to capacity and cannot carry any additional power."
My eyeballing of Tas data over various periods at OpenNem on the www shows the truth is way more complicated than Clark states.
https://opennem.org.au/energy/tas1/?range=1y&interval=1M
At this URL we see there were 5 months Dec2021 to Apr2022 incl where exports from Tas were low!! So Basslink was not assisting the mainland NEM with electricity much at all. Incidentally that is exactly the period where wholesale AEMO prices were steadily booming higher and higher for all NEM states.
Enough for now.
You’re right about the hyperbole. It’s becoming an epidemic.
DeleteIn the 15 weeks since HT abandoned BL in Feb 2022, inter-regional revenues were $17.5m compared to $27.6m in the corresponding period in 2021. Only 638 GWh of electricity was transported (that’s imports and exports)…… in 15 weeks.
For a 500 MW cable that’s hardly running at full capacity.
The other story (reported in the AFR) is that BL’s new Receivers have expedited the sale of the BL cable. I guess even Receivers have to obey the law and not trade while insolvent.
Will post something in the next day or so. Whatever happens will throw some light on where Tassie goes as a renewable energy source.
Interesting times.
https://saglamproxy.com
ReplyDeletemetin2 proxy
proxy satın al
knight online proxy
mobil proxy satın al
AU2MMS